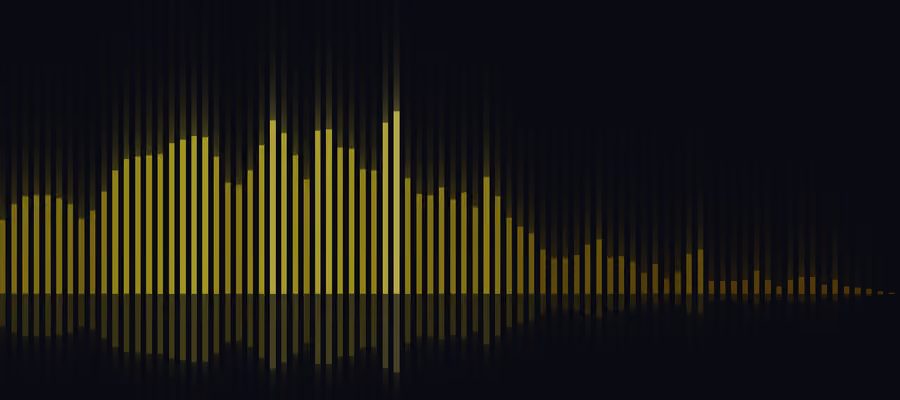

Today I released FFT Visualizer 1.0 — an open-source WebGL audio spectrum analyzer, published as a framework-agnostic TypeScript core with Vue and React wrappers. There’s a live demo where you can feed it your microphone or a SomaFM radio stream.
It Started as an Audio Control Panel
I have a Raspberry Pi that does audio routing and DSP. To control it, I built a web app with Nuxt, which I can open in a browser on my laptop allowing me to manage the audio routing and processing on the Pi from anywhere in the house. Later the Pi got a touchscreen, showing a version of the same app. One codebase, several screens.
Naturally, I wanted a live spectrum in those control pages — you want to see what the pipeline is doing. Unfortunately, every audio visualizer I found made two assumptions that were both wrong for me:
- The audio plays in the page. They analyze it with the Web Audio
AnalyserNode, which requires the browser to have the audio. My audio lives in the Pi’s pipeline — and when I open the UI on my MacBook, it isn’t even on the same machine. - Drawing on the CPU is fine. Canvas 2D, one draw operation per bar. On a laptop, sure. On a Pi whose CPU is deliberately reserved for DSP, while its own touchscreen renders the same page — no.
A native visualizer wasn’t the answer either, even on the Pi itself: a native app owns one framebuffer on one box. It can’t follow the control UI to whatever device happens to open it. The whole point was that the spectrum lives inside the web app, wherever that app is displayed.
So the requirements inverted the usual design: a visualizer that draws spectra computed elsewhere, for almost no CPU.
The Browser Only Draws
The pipeline computes the FFT — it’s doing DSP anyway. Getting the result onto the screens was a natural fit for WebSocket: every page that opens the control UI, whether it’s the Pi’s own touchscreen or a browser elsewhere in the house, connects and receives the same stream of frames. One producer, any number of viewers, binary payloads pushed at frame rate — no polling, and nothing that plain HTTP or server-sent events would do as cleanly for binary data.
The protocol on top is deliberately boring: one JSON config message, then binary frames.
{ "type": "config", "mode": "fft", "bins": 80, "fps": 120 }After that, every frame is just bins bytes — one uint8 magnitude (0–255) per frequency band. At 80 bins and 120 fps that’s under 10 KB/s. The repo ships reference servers in Python, Node and Rust, so the analysis side can be anything from a Pi to a proper server.
And because the visualizer is decoupled from the audio anyway, feeding it directly became as simple as this:
viz.feedData(new Uint8Array(bins))Anything that can produce 80 numbers can drive it — a server, a software-defined radio, a game, a test.
One Fragment Shader Draws Everything
The rendering side had to be nearly free on the CPU. The trick: there are no per-bar draw operations at all. The component renders a single full-screen quad, and one GLSL fragment shader computes every pixel — which bar it belongs to, whether it’s above or below the current magnitude, whether it falls in an LED gap, whether it’s in the reflection zone.
The core of it fits in a few lines. For each pixel, sample the FFT texture for this column and compare against the pixel’s height:
float texCoord = (floor(x * u_bins) + 0.5) / u_bins;
float fftValue = texture2D(u_fftData, vec2(texCoord, 0.5)).r;

if (y <= fftValue) {
  return vec4(getGradientColor(gradientPos), 1.0);
}
Everything else — LED segments, glow, peaks, the mirrored reflection — is more per-pixel math in the same pass. Even the radial mode is just a polar transform at the top of the shader: angle becomes the band axis, radius becomes the level axis, and the same bar-rendering code draws a circle.
The result is one draw call per frame regardless of settings. The CPU uploads up to a few hundred bytes of texture data and goes back to its DSP; the GPU does the rest. That’s what lets the Pi’s touchscreen show 80 stereo bands at high frame rates while the same CPU runs the audio pipeline.
That’s easier to see than to describe — so here is the component itself, running in this page. Give it a live radio stream or your own microphone, and switch presets while it plays: radial, stereo, LED meter and the rest are all the same shader, just different props.
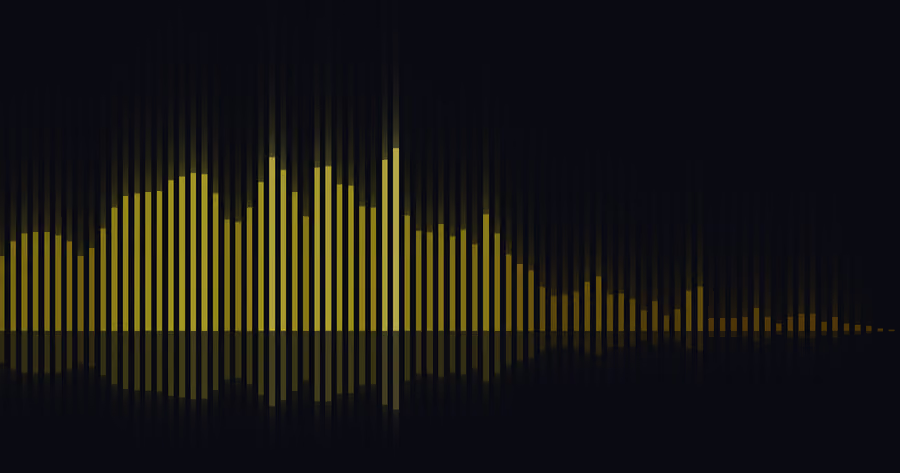
There is no DSP pipeline behind this page, so it does the analysis itself: the same Rust/WASM FFT, run in the browser over the radio stream or the mic, pushed in frame by frame through the external-data API — the same entry point a Pi would feed over WebSocket.
The FFT That Came Along Later
Once the component existed, the obvious question was: what if you don’t have a pipeline? For demos, dashboards and normal web apps, requiring a WebSocket server is absurd.
So local capture became the convenience mode: microphone or tab audio, analyzed in the browser. But in keeping with the project’s spirit, it doesn’t use the AnalyserNode — the FFT runs in a small Rust/WASM module that’s lazy-loaded only when you use this mode. That keeps the processing chain (windowing, weighting, normalization) under the library’s control and consistent with the server-side reference implementations, instead of inheriting the AnalyserNode’s fixed choices.
The zero-backend quick start ends up being one line:
<FFTVisualizer mode="local" :bands="40" gradient="aurora" />From One Screen to a Library
What started as a widget in a Pi control panel is now a monorepo of three packages:
@fft-visualizer/core— the engine as a vanilla TypeScript class, zero dependencies@fft-visualizer/vue— Vue 3 component@fft-visualizer/react— React component
The wrappers are deliberately thin — they map props onto the core’s options — so all three stay feature-identical. Version 1.0 is a statement of API stability: the options surface, the WebSocket protocol and the data modes are now stable, and anything breaking will ship in a new major.
The docs are at fftvisualizer.com — including an MCP server so your AI assistant can answer from the actual documentation instead of hallucinating an API for a two-week-old package.
Try It
The live demo runs all four playgrounds (vanilla, Vue, React, Nuxt) with presets and a live radio source. If you build something with it — especially if you feed it from somewhere unexpected — I’d love to hear about it: @HarmonicsAudio on X, @vernaillen@fosstodon.org on Mastodon, or the GitHub repo.